58 How does the group cover various types of monitoring in both horizontal and vertical dimensions.
Mainly divided into two parts to share:
1. The overall architecture of the website
2. Establish a three-dimensional monitoring system
The overall architecture of the website
Business Cluster

For most of the technicians, the most familiar is the business cluster, on which we implement the business logic, and Nginx distributes the traffic to these business clusters.
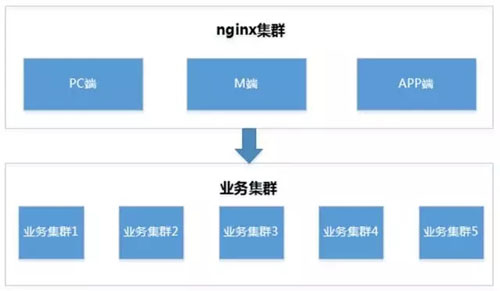
As shown above, the relevant architecture is familiar to everyone, so we will not elaborate. Below, I will elaborate on the architecture of the traffic access end of large websites both inside and outside the data center.
Outside the machine room
User访问 a page, enters the URL in the browser's address bar, presses the Enter key, and the page loads, what steps are involved?
For example, by looking at the developer tools in the browser, we can see that a typical page loads and renders a lot of page resources.
Not only does it load many document types of resources, such as HTML; it also loads many static resources, such as CSS, JS, and image files.
We divide the former into dynamic content and the latter into static resources. If we only have one data center in the whole country, users all over the country need to cross multiple regions and multiple operators' networks to access the website, as shown in the figure below, and the access speed must not be very fast.
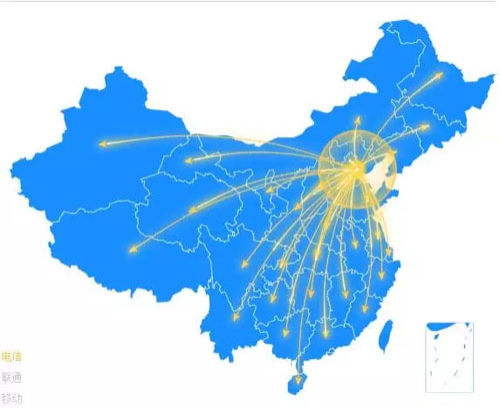
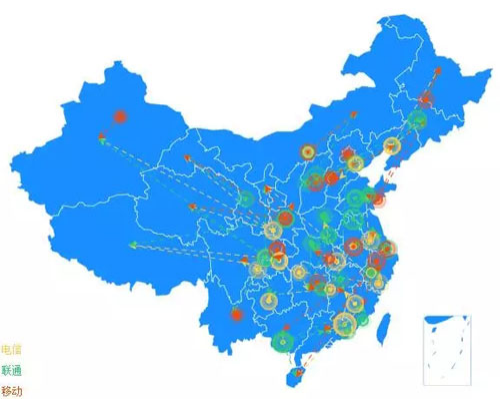
How to solve this problem? The simplest method is to let users access the page resources nearby, establish nodes in the network with a large number of users in various regions and operators, and let users access nearby.
As shown in the figure below, circles of different colors represent different operators, and node covers the area with a large number of pages.
The vast majority of the resources loaded on a page are static, and this can be used to significantly improve the page load time.
This technology is called CDN technology (Content Delivery Network, i.e. content delivery network).
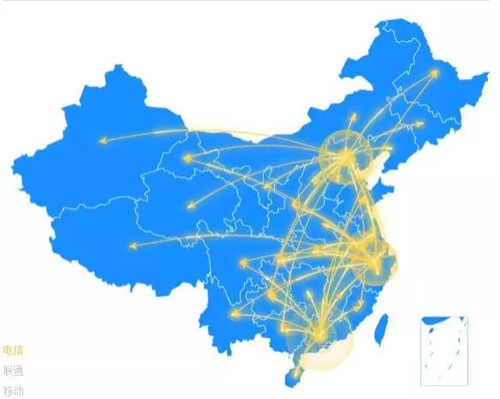
The optimization idea for dynamic requests is also similar. What was mentioned earlier is the case where only one data center provides dynamic request response, and the dynamic request response speed for users in the south is slower.
As shown in the figure below, if a data center is deployed in the East China, South China and other regions, it can better cover the users in East China and South China, and improve the access speed of dynamic content.
So, how does this CDN achieve the nearby access to static resources? It uses the DNS scheduling method.
We all know the steps involved in making a request via the HTTP protocol are as follows:
· Domain Name Resolution
· Establish a connection
· Send request
· Receive response
As shown in the figure below, when a user initiates a domain name resolution request to the domain name resolution server, the DNS server returns the IP address of the closest CDN node to the user, thus achieving the user's nearby access.
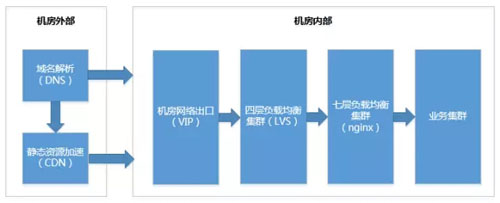
Data center interior
As shown above, after the domain name resolution stage, dynamic requests will directly access the data center (dynamic content can also be accelerated), and static resources will also return to the source (to obtain resource files from the data center) when there is no cache. In both cases, the VIP of the data center will be accessed.
After passing through the four-layer load balancing and the seven-layer load balancing cluster, the traffic is distributed to the business cluster. There will also be mutual calls between the business clusters.
There is a primary and a standby for each key cluster, and if the primary cluster has a problem, it switches to the standby cluster; the primary and standby clusters can also provide services simultaneously, with each cluster reserving resources to handle all traffic.
Each cluster contains multiple servers, and a few servers going down do not affect the cluster's ability to provide services. The data center network exit provides a backup link, which can automatically switch to the backup link if the main link fails.
当遇到极端情况,两条链路都中断的情况,可以切换域名的解析结果和 CDN 的回源 IP 到备份机房的 VIP,然后通过机房之间的专线将流量导入。如果有多个机房,那么直接将流量切到其他正常的机房即可。
构建立体化的监控体系
监控的定位和目标
监控的定位和目标如下:
· 线上服务的守护神,服务稳定性的重要保障
· 运维和研发、测试人员的眼睛,快速发现和排查故障
· 将运维数据进行量化和可视化,便于对网站进行优化
监控系统架构
监控系统的底层模块基于 Open-Falcon,上层做了很多深度的二次开发,整体系统架构图如下:

监控的应用规模
监控体系在 58 集团的应用规模如下:
· 覆盖了近万台服务器,包括 58 集团下属的各网站,如 58 同城、赶集网、中华英才网、安居客、转转。
· 监控的业务指标,监控系统中配置了超过 3000 个集群、近 3000 个监控模板、近 300 万个监控指标、每天实时处理的数据量超过 2T。
立体化监控体系概述
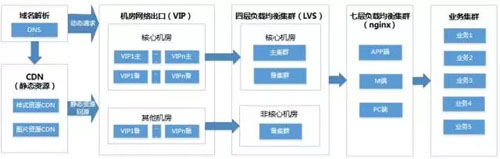
参考网站的架构图,立体化的监控体系包括纵向和横向两个方向。
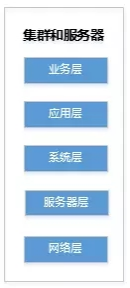
纵向实现了自底向上各层级的监控,包括网络、服务器、系统层、应用层、业务层,如下图所示:
横向实现了从外到内各层级的监控,包括用户端、机房网络出口端、流量接入端、业务端等,如下图所示:
纵向各层级的监控指标
网络监控
最基本的网络监控包括:
· 机房出口 VIP 是否存活,从机房外对 VIP 进行 ping,如果连续多次发现 VIP 不通则发出告警。
· 流量是否正常,在四层网络设备上监测出入流量和包量等关键指标。
· 机房间专线流量和质量是否正常,以及网络设备及流量是否正常等。在机房之间的网络设备上监控专线的流量和质量,例如:带宽使用量,丢包率、ping 延时等。
服务器监控
服务器的监控包括服务器是否宕机,服务器硬件是否有异常等。
宕机监控,在每个机房都部署监控机,通过 ping 的方式对同机房的服务器进行宕机监控。
为了避免网络抖动的影响,当连续多次发现 ping 不通则发出宕机告警。
Deploying in the same机 room is to avoid a large number of false positives and crashes due to network link issues between机 rooms.
On the monitoring management level, different templates are configured to send different alarms to users in different clusters and different roles, for example: voice alarm for the failure of the master database, and SMS alarm for the failure of other machines in the cluster.
Server hardware monitoring, by deploying plugins on the monitoring Agent, can support a wide variety of hardware monitoring very well, and it is also very convenient to adapt to hardware. The coverage of hardware monitoring depends on business needs.
System monitoring
Server resource utilization, including CPU, memory, disk, network card and other indicators.
For a medium to large internet company, the business is relatively complex, and servers are divided into different clusters according to their purpose, managed by different operation and development personnel.
So adding these monitors is a big workload for technicians, and it's hard to guarantee the coverage of monitors only by relying on people to add monitors. Our idea is to add basic monitors as automatically as possible.
We summarized the requirements of various businesses on the system monitoring level, determined some core monitoring indicators, abnormal judgment conditions, alarm methods, etc., and generated a default monitoring template.
Our CMDB system contains the most basic server asset data, including the name of the cluster, a list of servers in the cluster, the person in charge of operation and maintenance and R&D of the cluster, etc.
This will allow you to synchronize this information from the CMDB, automatically add basic system monitoring in the monitoring system for each cluster, i.e. automatically add clusters, automatically create monitoring templates (inheriting the basic monitoring template), and send alerts to the operation and development responsible as required.
In this way, all cluster basic monitoring has been covered 100% in a short period of time, at least it can effectively issue alarms for server crashes and system resource usage issues, which have caused anomalies, and quickly solve the core pain points in the initial construction of monitoring.
For some clusters, due to the particularity of the business, the basic monitoring template cannot meet their needs, and the monitoring indicators can be inherited from the parent template, and then the alarm conditions and alarm methods can be modified.
Application monitoring
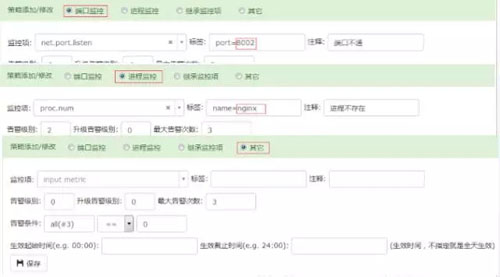
Application monitoring is used to monitor whether the deployed applications are running normally, including: ports, processes, functions (pages or interfaces), QPS, number of connections and other indicators.
Generally speaking, it takes some effort and has a certain degree of difficulty for operation and maintenance and development personnel to create monitoring templates, associate them with clusters, and configure alert recipients. In some cases, monitoring and alerts may not take effect due to configuration issues.
为了解决这个问题,我们基于自动添加的系统监控:
· 一方面从部署上线系统同步应用程序的端口等信息,自动添加端口监控。
· 另一方面基于系统监控的模板,允许用户方便的添加应用监控,例如:只需要填写端口、进程名等就可以方便的添加端口监控和进程监控。
对于功能(页面或接口)、QPS、连接数等指标,我们也提供了部署监控插件进行监控的方式。
用户可以通过帮助文档页面下载多种语言(Java、PHP、Python,Shell等)的监控插件模板,然后进行简单修改,采集到被监控指标后可以方便的接入监控系统。
通过这种方式我们快速提升了应用监控的覆盖率。
业务监控
业务的监控对象包括业务关心的各项指标,例如订单量、成交额等。
由于业务监控和具体的业务相关,不能采用通用的方式进行监控,所以采用自定义监控插件的方式监控。
所有可以采集到的指标都可以添加监控和告警;将数据以 Json 格式发给监控 Agent 即完成数据上报。
横向各层级的监控指标
用户端
有如下几种采集数据的方式:
· 使用在用户端网络内合作用户电脑或手机上部署的探针进行探测。
· 在页面中嵌入 JS 代码,从真实用户的浏览器端对性能数据进行采集。
· 在 APP 端嵌入 SDK,从真实用户的 APP 对访问错误和性能数据进行采集。
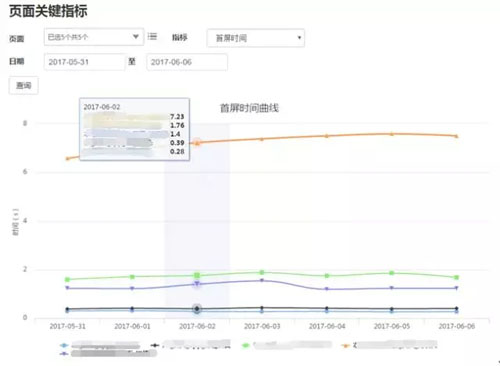
采集的数据包括用户端可用性、首屏时间、全部资源下载时间、全部资源字节数、基础 HTML 页面下载时间等数据,如下图所示:
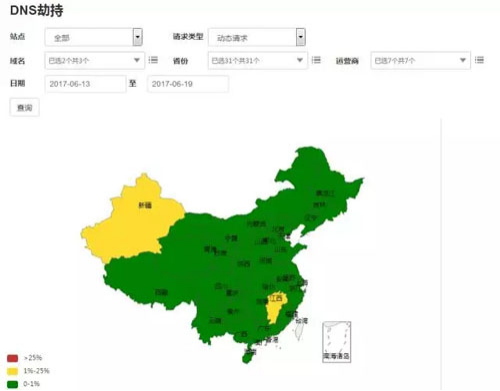
另外,还可以对 DNS 劫持、链路劫持、访问出错、访问速度较慢的问题进行告警,以 DNS 劫持数据的展示举例
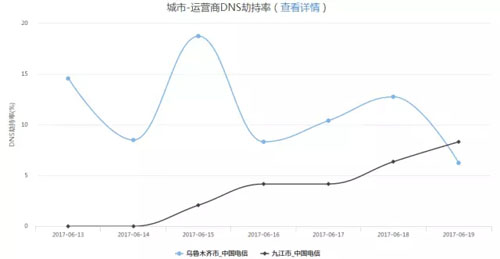
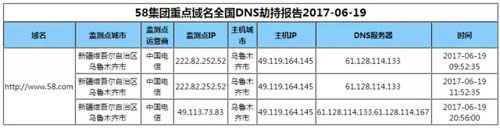
点击图例后,跳转到详情数据:
机房网络出口端
既可以在网络设备上采集流量,也可以在四层负载均衡上采集流量。并可分别对网络的连通性、进出流量、进出包数等关键指标进行监控。
页面和接口监控
对重点页面、接口的可用性、响应时间进行监控。
这些监控都是对机房出口的 VIP 发起请求,流量经过负载均衡服务分发到后端业务集群,业务集群内有少量服务器出现异常,负载均衡服务会自动到另一台服务器重试,异常不会暴露给外部用户。
当探测此处的页面和接口监控发现了异常,那么用户已经可见了,是比较严重的故障。
通过这种监控方式也可以比较客观的评价业务集群的运行状况,重点关注的指标的稳定性和响应时间。
页面监控:对页面的基础页面(即 HTML)进行探测,连续一段时间发现状态码与预期不一致、响应时间过长、找不到匹配的关键词、页面长度较短等情况,会发出告警。
接口监控:对接口进行探测,连续一段时间发现状态码与预期不一致、响应时间过长,接口返回的消息体中业务状态码不符合预期或数据长度较短等情况,会发出告警。
流量接入端
大型网站的流量接入端包括四层和七层的负载均衡集群。
一般的网站可以使用 LVS 提供四层负载均衡服务,技术实力雄厚的公司可以使用自己定制开发的四层负载均衡服务。
七层负载均衡端是流量接入端的重要服务,处于用户流量接入的咽喉要道,重要性不言而喻,所以要有完善的监控。
另外由于所有流量都经过该服务,可以收集到很多用户端访问和后端业务集群运行状况的数据。
一般七层的负载均衡服务使用 Nginx,除了基础的服务器、系统、应用层的监控,还可以实现更多的监控。
有以下几种方式实现:
· 将日志实时传输,集中计算,再将结果给监控服务端。
· 将日志在 Nginx 上实时计算,传送结果给监控服务端。
· 用 Lua 实现 Nginx 扩展,实时计算,传送结果给监控服务端。
我们采用了第一种方式,复杂的计算不占用 Nginx 集群的计算资源。
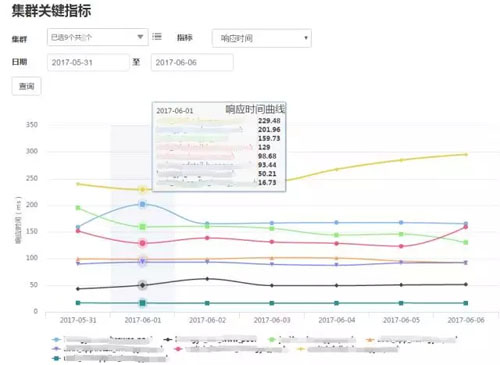
采集的指标包括(如下图):
· 各域名的各种状态码的数量和比率、响应时间。
· 各后端集群的各种状态码的数量和比率、响应时间。
业务集群端
在流量接入端已经能够对业务集群的可用性、响应时间等关键指标进行监控和告警,对业务集群还可以按照纵向各层级添加监控指标。
其他核心功能
监控数据展示
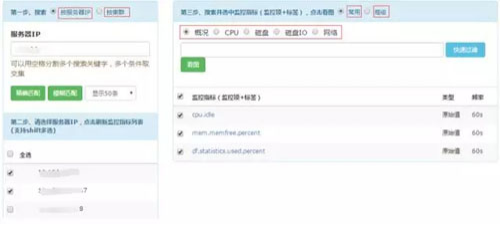
用户能够按照服务器和集群查看监控指标,为了便于用户使用,可以直接查询最常用的监控指标。
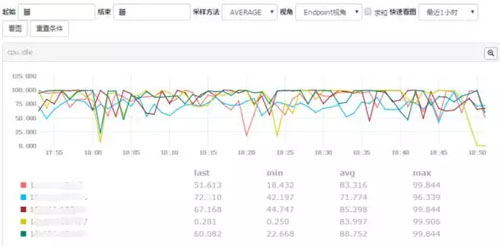
可以在一个视图中展示所有机器的某项监控指标:
监控异常查看
为了方便用户查看当前有哪些异常,我们提供了监控异常查看页面,且可以对信息进行搜索:
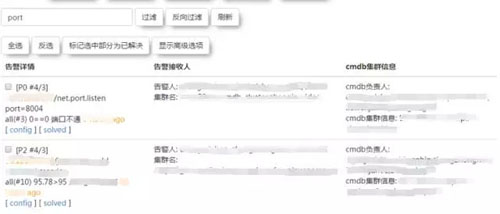
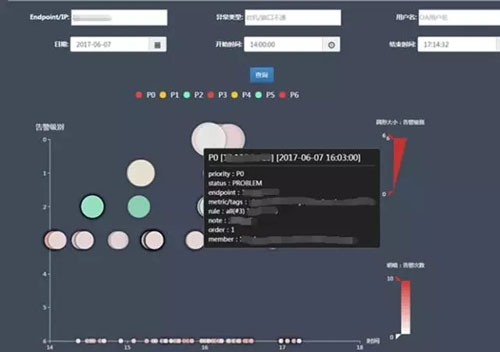
You can also view all recent alerts on the time dimension:
Monitoring wall
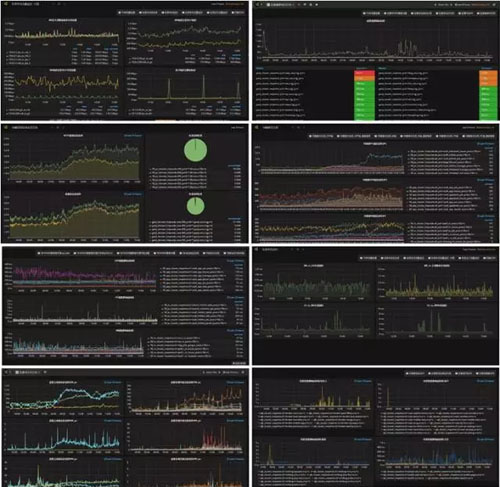
To facilitate duty and patrol, we provide a monitoring wall function that can be displayed on the monitoring big screen:
Capacity management
In order to facilitate the improvement of resource utilization of the server, timely detect the system performance bottleneck, and provide data support for server application, we have developed a capacity management system based on the data of the monitoring system.
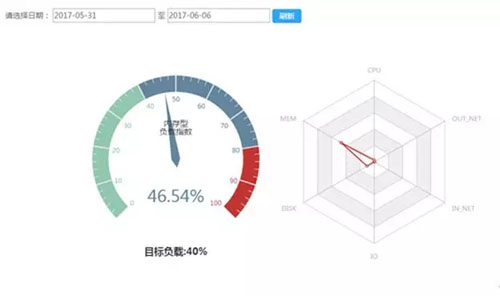
The first step is to achieve the basic capacity evaluation of the cluster, and analyze the cluster load through several major system load parameters (CPU, memory, disk space, disk IO, network card in and out traffic utilization). Subsequently, more business indicators can be added to manage the capacity.